Übersetzung und Analyse von Wörtern durch künstliche Intelligenz
Auf dieser Seite erhalten Sie eine detaillierte Analyse eines Wortes oder einer Phrase mithilfe der besten heute verfügbaren Technologie der künstlichen Intelligenz:
- wie das Wort verwendet wird
- Häufigkeit der Nutzung
- es wird häufiger in mündlicher oder schriftlicher Rede verwendet
- Wortübersetzungsoptionen
- Anwendungsbeispiele (mehrere Phrasen mit Übersetzung)
- Etymologie
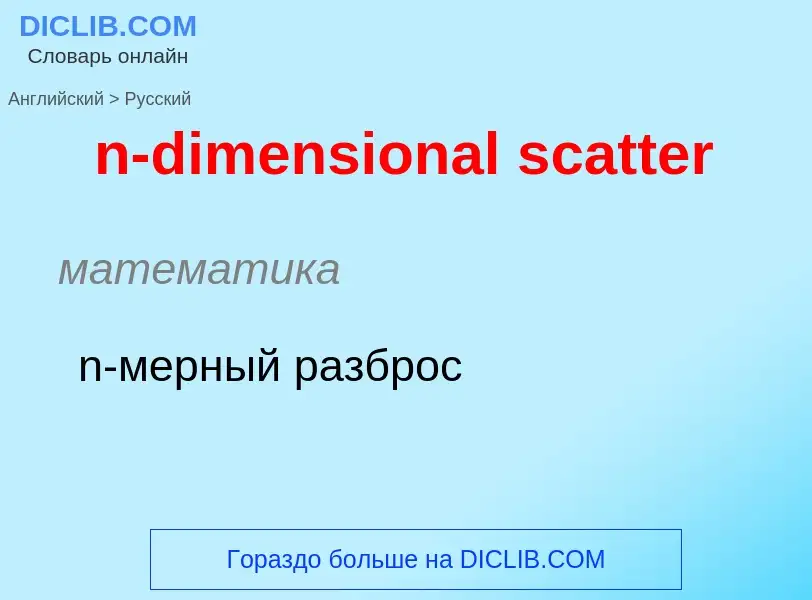
n-dimensional scatter - Übersetzung nach Englisch
математика
n-мерный разброс
общая лексика
диаграмма рассеивания
математика
точечная [корреляционная] диаграмма
скаттер-диаграмма
диаграмма разброса (способ графического отображения данных в виде точек в системе координат; в бухгалтерском учете используется для отображения объемов затрат для различных уровней производства или продаж, для разделения смешанных затрат на постоянную и переменную составляющие)
синоним
Смотрите также
математика
диаграмма рассеивания
Definition
Wikipedia
A scatter plot (also called a scatterplot, scatter graph, scatter chart, scattergram, or scatter diagram) is a type of plot or mathematical diagram using Cartesian coordinates to display values for typically two variables for a set of data. If the points are coded (color/shape/size), one additional variable can be displayed. The data are displayed as a collection of points, each having the value of one variable determining the position on the horizontal axis and the value of the other variable determining the position on the vertical axis.

